Agent Framework OpenTelemetry tracing in C# with Claude
Summarize with AI
The assistants open a new chat that asks for a short summary of this post.
The idea: a trace shows what happened inside a run, one span per model call, tool call and workflow step, with the token counts on each. The framework counts tokens. Turning them into money takes a price table that you keep yourself.
Ask the kitchen assistant “What can I cook tonight?” and it answers with a frittata. The answer doesn’t show that it took two model calls and a tool call, that the first call already sent 410 input tokens for a three-line instruction and a five-word question, or that the second call took about two seconds. A trace does. Microsoft Agent Framework writes OpenTelemetry spans for agents and workflows. A plain dotnet run prints them in the terminal, and the Aspire dashboard shows them as a tree. Below, the kitchen assistant and the planner-to-reviewer workflow from the first workflow post are traced, the messages appear in the spans only in development, and the token counts become a cost in dollars.
Versions: Microsoft Agent Framework 1.24.0, Aspire 13.6.1, OpenTelemetry 1.19.1 (SDK, console and OTLP exporters), .NET 10.
Code: samples/agent-framework/12-observability, a runnable version of this post with its tests.
Who this is for: C# developers who have an agent with tools or a workflow running, as in Tool calling for AI agents in C# and Planner, then reviewer: two agents in one workflow.
Note
The code runs on Claude Haiku 5.5, but it depends only on IChatClient: the first post shows the swap to OpenAI or Ollama.
The prices and the cache token counts follow Anthropic’s price list and connector; another provider needs its own prices and may report cached tokens under another key. The output limit of 4,096 tokens is sized for Haiku, which counts its reasoning as output.
Add OpenTelemetry and an exporter
A console app with the agent, Anthropic and workflow packages, plus the OpenTelemetry SDK and two exporters. The console exporter prints every span and metric in the terminal. The OTLP exporter sends them to anything that speaks the OpenTelemetry protocol, the Aspire dashboard included:
dotnet new console -n KitchenTracescd KitchenTracesdotnet add package Microsoft.Agents.AI --version 1.24.0dotnet add package Microsoft.Agents.AI.Anthropic --version 1.24.0dotnet add package Microsoft.Agents.AI.Workflows --version 1.24.0dotnet add package OpenTelemetry --version 1.19.1dotnet add package OpenTelemetry.Exporter.OpenTelemetryProtocol --version 1.19.1dotnet add package OpenTelemetry.Exporter.Console --version 1.19.1Libraries write spans to an ActivitySource, which has a name. Nothing is recorded for a source until something subscribes to that name. In OpenTelemetry that is the tracer provider, and each AddSource call adds one name:
using System.ComponentModel;using System.Globalization;using Anthropic;using Anthropic.Core;using Microsoft.Agents.AI;using Microsoft.Agents.AI.Workflows;using Microsoft.Extensions.AI;using OpenTelemetry;using OpenTelemetry.Metrics;using OpenTelemetry.Trace;
const string SourceName = "Kitchen";
// Aspire sets the endpoint. A plain `dotnet run` doesn't, so the// spans and metrics go to the console instead.bool hasCollector = !string.IsNullOrEmpty( Environment.GetEnvironmentVariable("OTEL_EXPORTER_OTLP_ENDPOINT"));
TracerProviderBuilder tracerBuilder = Sdk.CreateTracerProviderBuilder() .AddSource(SourceName) .AddSource("Microsoft.Agents.AI.Workflows");using TracerProvider tracing = hasCollector ? tracerBuilder.AddOtlpExporter().Build() : tracerBuilder.AddConsoleExporter().Build();
MeterProviderBuilder meterBuilder = Sdk.CreateMeterProviderBuilder() .AddMeter(SourceName);using MeterProvider metrics = hasCollector ? meterBuilder.AddOtlpExporter().Build() : meterBuilder.AddConsoleExporter().Build();Kitchen is the app’s own name for its agent spans; the agents below are told to use it. Microsoft.Agents.AI.Workflows is the name the workflow spans use. The meter provider does the same for metrics.
Which exporter runs depends on one environment variable. AddOtlpExporter() without arguments takes its endpoint and protocol from the standard OTEL_EXPORTER_OTLP_* variables, which Aspire sets further down. A plain dotnet run doesn’t set them, so the spans and metrics go to the terminal. The OTLP exporter sends in batches on a background thread, so the using declarations matter in a console app: disposing the providers when the program ends flushes the spans that are still waiting.
Wrap the agent in UseOpenTelemetry
The chat client is Claude Haiku 5.5, as in the other parts, with an output limit of 4,096 tokens because the reviewer below reasons before it answers. A small local function wraps any agent in telemetry:
bool isDevelopment = Environment.GetEnvironmentVariable("DOTNET_ENVIRONMENT") == "Development";
var apiKey = Environment.GetEnvironmentVariable("ANTHROPIC_API_KEY") ?? throw new InvalidOperationException("Set ANTHROPIC_API_KEY.");
IChatClient chatClient = new AnthropicClient(new ClientOptions { ApiKey = apiKey }) .AsIChatClient("claude-haiku-5-5", 4096);
AIAgent Traced(AIAgent agent) => agent .AsBuilder() .UseOpenTelemetry( SourceName, configure: otel => otel.EnableSensitiveData = isDevelopment) .Build();UseOpenTelemetry wraps the agent in an OpenTelemetryAgent, which writes an invoke_agent span for every run. It also switches on telemetry inside the agent’s own chat pipeline, below the FunctionInvokingChatClient that runs the tools, under the same source name. That gives a chat span for every model call and an execute_tool span for every tool call, nested under the agent’s span, without instrumenting the chat client yourself. If the chat client already carries OpenTelemetry instrumentation of its own, the agent leaves it alone and adds no second set of chat spans.
The source name is optional, and leaving it out is a common reason for an empty dashboard. Without one, the spans go to a source named Experimental.Microsoft.Agents.AI, which neither AddSource("Microsoft.Agents.AI") nor AddSource("Microsoft.Agents.AI*") matches. Passing the same constant to UseOpenTelemetry and AddSource avoids the guesswork.
The agent is the kitchen assistant from the tools post, with one simpler tool, list_pantry, instead of the two pantry tools, and shorter instructions:
AIAgent kitchen = Traced(chatClient.AsAIAgent( name: "kitchen-assistant", instructions: """ You help one household decide what to cook. Check the pantry before you suggest a dish. Answer in at most three sentences. """, tools: [AIFunctionFactory.Create(ListPantry, name: "list_pantry")]));
AgentResponse answer = await kitchen.RunAsync("What can I cook tonight?");Console.WriteLine(answer.Text);The tool is a static local function at the end of Program.cs:
[Description("Lists what is in the household's pantry.")]static string ListPantry() => "rice, eggs, onions, spinach, feta";Read the spans in the terminal
dotnet run, with the key in ANTHROPIC_API_KEY, prints each span when it ends. A child ends before its parent, so the chat and execute_tool spans come first and the agent’s invoke_agent span after them. One run prints 28 spans and about 900 lines, most of them the workflow’s spans from further down. Filtered to the span names and token counts, the kitchen assistant’s part reads:
Activity.DisplayName: chat claude-haiku-5-5 gen_ai.usage.input_tokens: 410 gen_ai.usage.output_tokens: 28Activity.DisplayName: execute_tool list_pantryActivity.DisplayName: chat claude-haiku-5-5 gen_ai.usage.input_tokens: 461 gen_ai.usage.output_tokens: 150Activity.DisplayName: invoke_agent kitchen-assistant(4ef44cf1aa4b4ae489ba5caa5718c06d) gen_ai.usage.input_tokens: 871 gen_ai.usage.output_tokens: 178The filter is grep -E 'DisplayName|usage\.(in|out)put_tokens'. Two model calls with a tool call between them, and the agent span adds their tokens up. The first chat span in full:
Activity.TraceId: c2bb31d567c3b1dc002405709252d3dfActivity.SpanId: adf6d6fe538ffc24Activity.TraceFlags: RecordedActivity.ParentSpanId: 5c2c875c0230768eActivity.DisplayName: chat claude-haiku-5-5Activity.Kind: ClientActivity.StartTime: 2026-10-15T10:09:02.6574430ZActivity.Duration: 00:00:00.9885410Activity.Tags: gen_ai.operation.name: chat gen_ai.request.model: claude-haiku-5-5 gen_ai.provider.name: anthropic server.address: api.anthropic.com server.port: 443 gen_ai.tool.definitions: [ { "type": "function", "name": "list_pantry" }] gen_ai.response.finish_reasons: ["tool_calls"] gen_ai.response.id: msg_011Cg3qehCvcSHFgNQvzMU9M gen_ai.response.model: claude-haiku-5-5 gen_ai.usage.input_tokens: 410 gen_ai.usage.output_tokens: 28 gen_ai.usage.cache_read.input_tokens: 0Instrumentation scope (ActivitySource): Name: KitchenResource associated with Activity: telemetry.sdk.name: opentelemetry telemetry.sdk.language: dotnet telemetry.sdk.version: 1.19.1 service.name: unknown_service:KitchenTraces Schema URL: https://opentelemetry.io/schemas/1.44.0ParentSpanId is how the spans fit together: both chat spans and the execute_tool span have the agent span as their parent. The finish reason tool_calls says the model stopped to ask for a tool, and the second chat span carries the answer. The service name is unknown_service, because nothing in a plain dotnet run sets one; Aspire does, below. Model output varies from run to run, so the counts in the sections that follow, from a run under Aspire, differ slightly from these.
The same spans in the Aspire dashboard
The terminal shows every span, but as a flat list. An Aspire AppHost starts the app, hands it the API key and runs the dashboard that receives its telemetry. It needs the Aspire CLI, which installs with one command from aspire.dev (the samples repository’s prerequisites list it for macOS, Linux and Windows); this post uses Aspire 13.6.1. Then, from the folder above KitchenTraces, install the project templates of the same version, create the AppHost and give it a reference to the app:
cd ..dotnet new install Aspire.ProjectTemplates::13.6.1dotnet new aspire-apphost -n KitchenTraces.AppHostdotnet add KitchenTraces.AppHost reference KitchenTracesThe reference is where Projects.KitchenTraces below comes from: the AppHost gets a generated class for every project it references. The template’s AppHost.cs only builds and runs; this one adds the app:
var builder = DistributedApplication.CreateBuilder(args);
var apiKey = builder.AddParameter("anthropic-api-key", secret: true);
builder.AddProject<Projects.KitchenTraces>("kitchen-traces") .WithEnvironment("ANTHROPIC_API_KEY", apiKey) .WithEnvironment("DOTNET_ENVIRONMENT", builder.Environment.EnvironmentName);
builder.Build().Run();AddParameter with secret: true declares a value that the AppHost reads from its configuration under Parameters:anthropic-api-key, and WithEnvironment hands it to the app as ANTHROPIC_API_KEY, the variable the app reads. The template gave the AppHost a UserSecretsId, so the key can go into user secrets. (The samples’ AppHosts share the ID kootstra-samples instead, so one stored key serves all of them.) read -rs asks for it without echoing it, so it isn’t typed into the command and stays out of the shell history:
read -rs KEY && dotnet user-secrets set Parameters:anthropic-api-key "$KEY" --project KitchenTraces.AppHost; unset KEYaspire run, from the same folder, builds and starts the AppHost, which starts the app, and prints a link to the dashboard. The app answers and exits, and the dashboard keeps its spans until you stop the AppHost with Ctrl+C. aspire start does the same in the background, which is how the spans below were read; aspire stop ends it. Agent Framework DevUI in C# with Claude uses the same AppHost for a web app that keeps running, with a link to DevUI in the dashboard.
Aspire sets the exporter’s variables on the app for you. In this run they included OTEL_EXPORTER_OTLP_ENDPOINT, the dashboard’s address from the AppHost’s launch profile (https://localhost:21111 in the sample), OTEL_EXPORTER_OTLP_PROTOCOL=grpc and OTEL_SERVICE_NAME=kitchen-traces, which is the name the dashboard shows for the app. It did not set DOTNET_ENVIRONMENT: Aspire deliberately doesn’t hand its own environment name down to the apps it starts, and this project has no launch profile that sets one, so the variable was empty until the last line passed the AppHost’s environment name along. The section on recording messages needs it.
Read the trace
Start the AppHost in the background, wait for the app to exit, and list its spans. The Aspire CLI reads them from the dashboard:
aspire startaspire wait kitchen-traces --status downaspire otel spans kitchen-tracesThe first four spans belong to the question:
20:20:49.923 OK 3.38s kitchen-traces: invoke_agent kitchen-assistant(fa177f6f66bf41fe8fb7504ac428e67e) 97bb2c620:20:49.949 OK 1.28s kitchen-traces: chat claude-haiku-5-5 ccec3a720:20:51.241 OK 3.12ms kitchen-traces: execute_tool list_pantry dae2ece20:20:51.245 OK 2.05s kitchen-traces: chat claude-haiku-5-5 acf9502The invoke_agent span is the run, named after the agent’s name and Id. Under it, the first chat span is the model asking for list_pantry, the execute_tool span is your method running for 3 milliseconds, and the second chat span is the model writing the answer. The dashboard’s Traces page shows the same four spans as a tree with a timeline, and selecting a span lists its attributes. In a later run, with the second chat span selected:
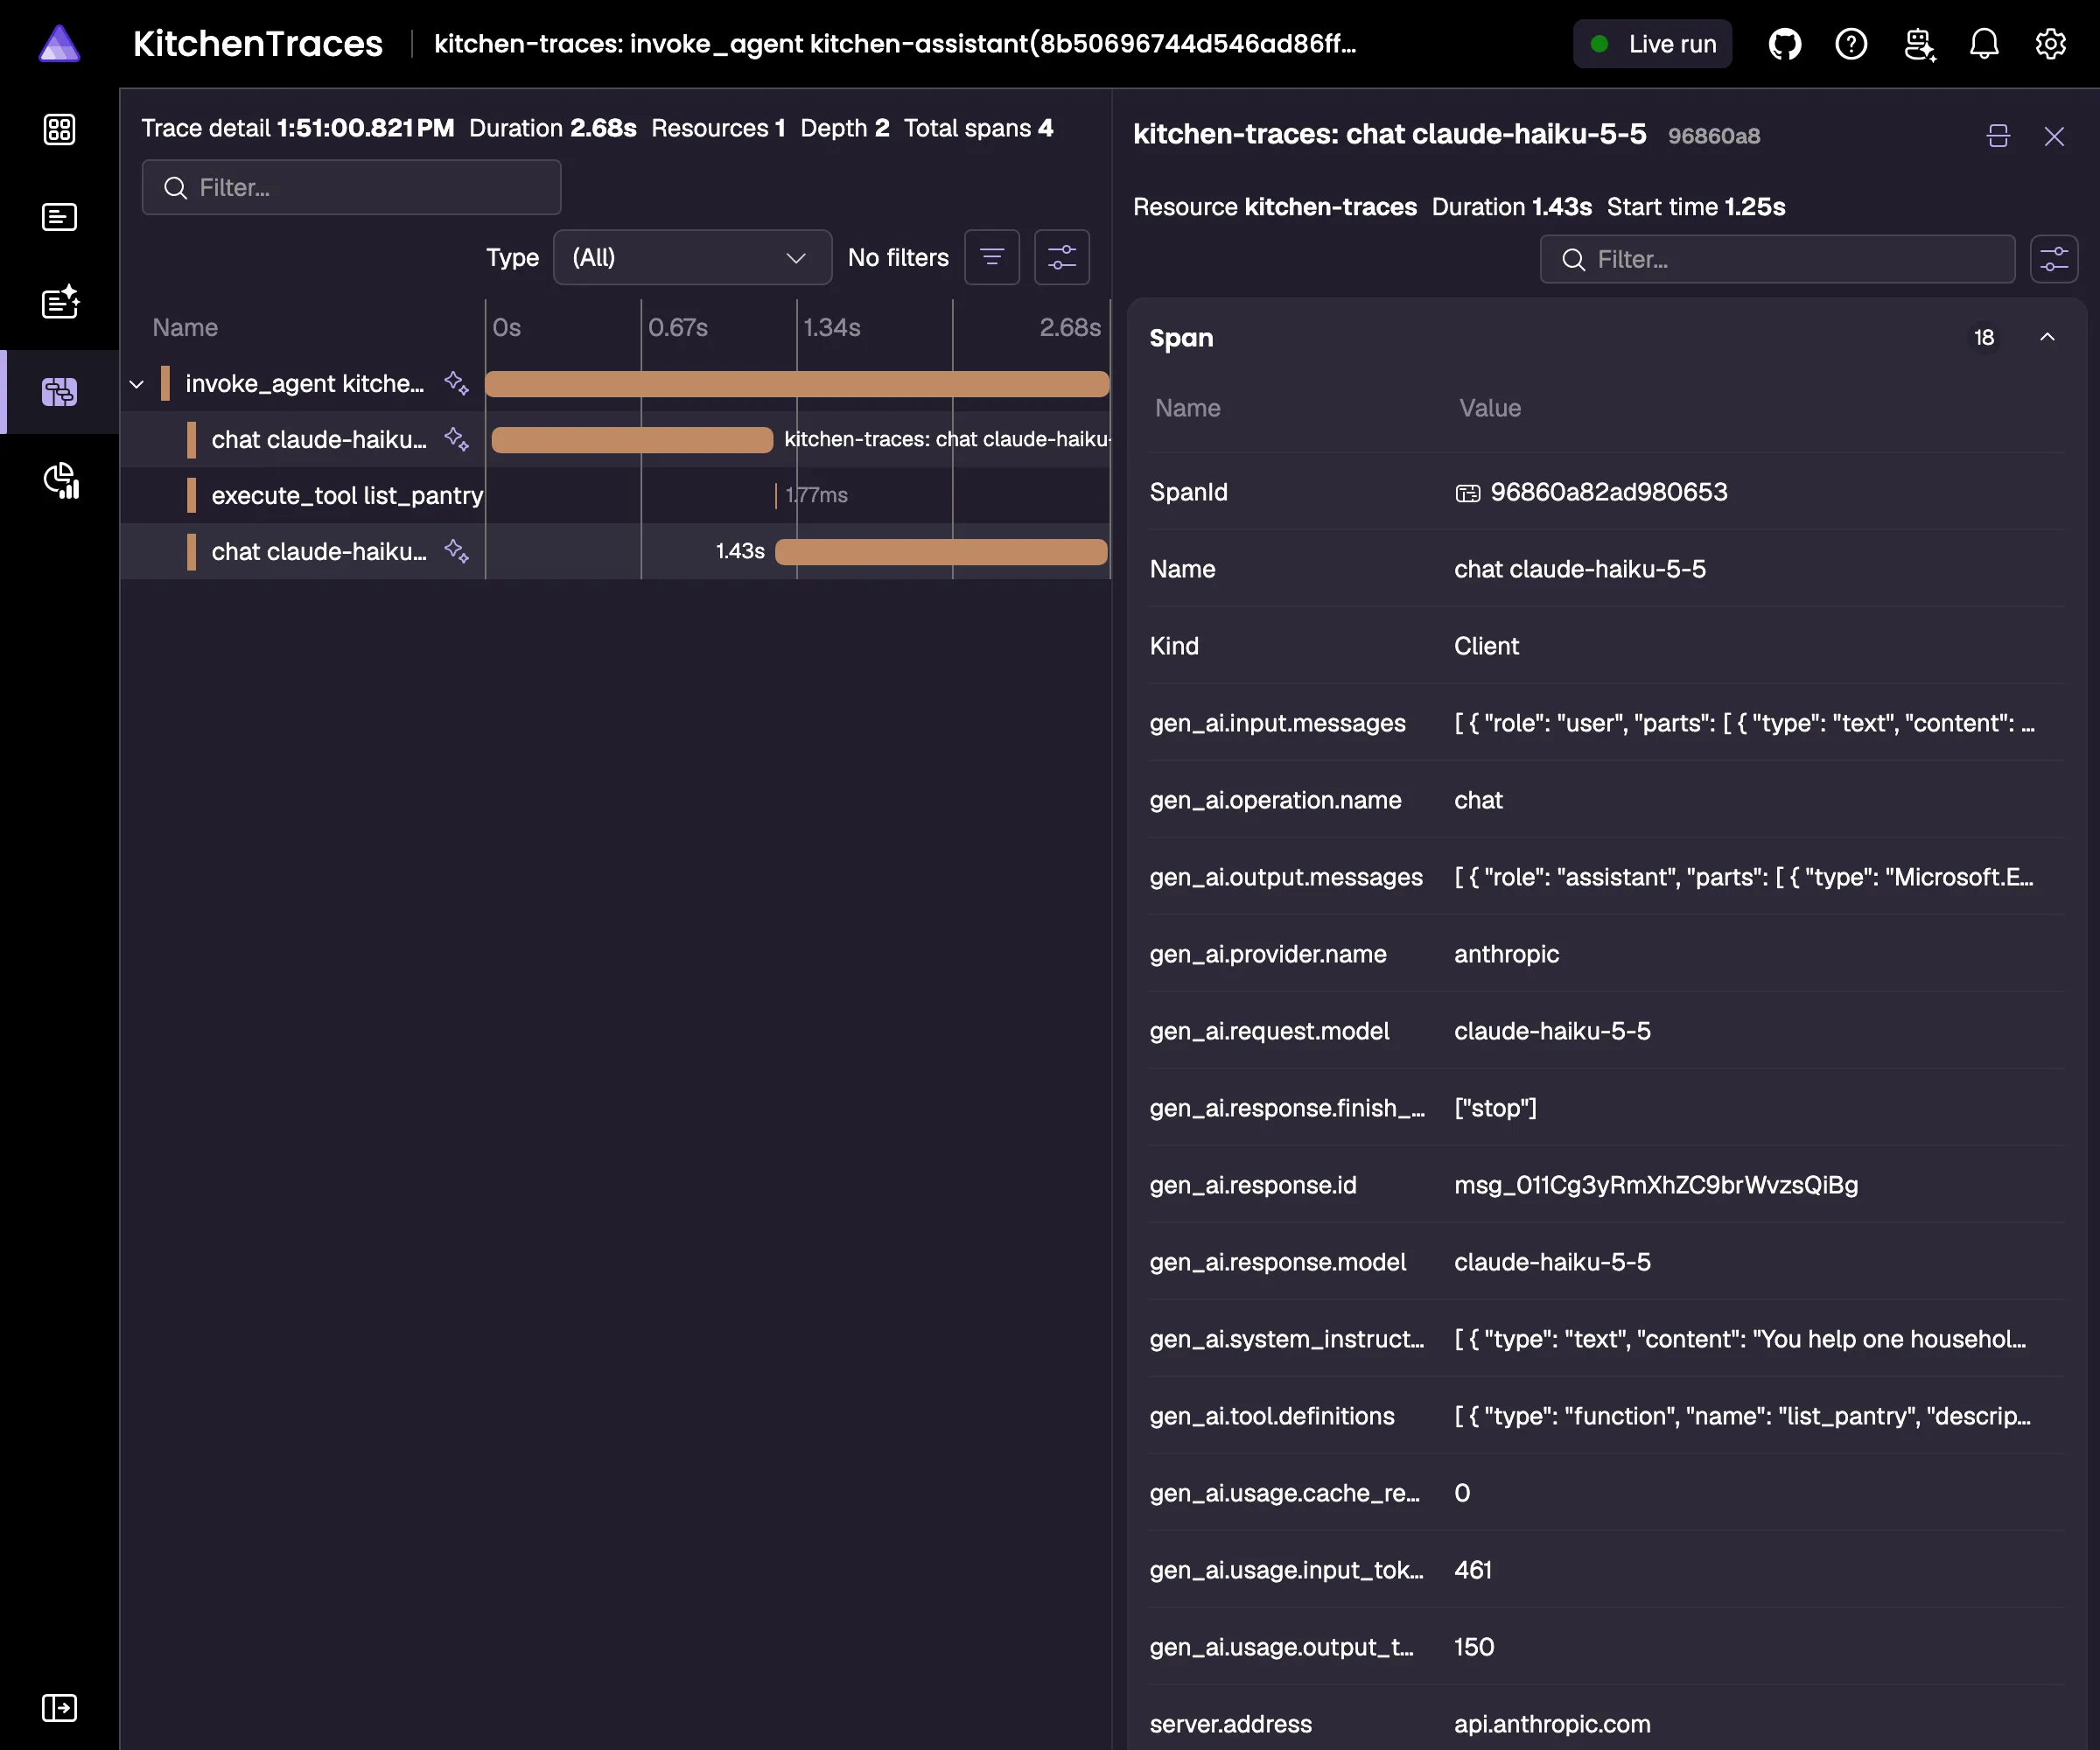
The messages are there because the AppHost runs the app in Development, which the next section is about. The token counts differ from the run above because the answer was a little shorter.
Each span carries attributes named after the OpenTelemetry semantic conventions for generative AI, so backends that understand those conventions read them the same way. These came from the spans above:
| Span | Attribute | Value |
|---|---|---|
invoke_agent |
gen_ai.agent.name |
kitchen-assistant |
invoke_agent |
gen_ai.provider.name |
anthropic |
first chat |
gen_ai.response.finish_reasons |
["tool_calls"] |
first chat |
gen_ai.usage.input_tokens |
410 |
first chat |
gen_ai.usage.output_tokens |
28 |
second chat |
gen_ai.usage.input_tokens |
461 |
second chat |
gen_ai.usage.output_tokens |
178 |
invoke_agent |
gen_ai.usage.input_tokens |
871 |
invoke_agent |
gen_ai.usage.output_tokens |
206 |
execute_tool |
gen_ai.tool.name |
list_pantry |
The agent’s span holds the sum of its model calls: 410 and 461 input tokens make 871. Each chat span holds the count for that one request, which is where a single expensive call shows up. The first call sent 410 tokens for three lines of instructions and a five-word question. According to Anthropic’s pricing page, a Claude Haiku 5.5 request with tools and the default tool choice gets a tool-use system prompt of 286 tokens, and the tool’s definition comes on top.
Record the messages only in development
By default the spans hold structure, timing and counts, not content. EnableSensitiveData adds the content. With it on, the spans above also carried gen_ai.input.messages, gen_ai.output.messages, gen_ai.system_instructions, the full tool definitions, and the tool call’s arguments and result:
gen_ai.operation.name = execute_toolgen_ai.tool.type = functiongen_ai.tool.call.id = toolu_01FwdjwTUzoAyVZwgaYBZowxgen_ai.tool.name = list_pantrygen_ai.tool.description = Lists what is in the household's pantry.gen_ai.tool.call.arguments = {}gen_ai.tool.call.result = "rice, eggs, onions, spinach, feta"That is what makes a wrong tool call explainable: the span shows the arguments the model produced and the messages they came from. It also copies whatever the household typed, and whatever the tools returned, into the telemetry backend, with that backend’s access rules and retention. So Traced turns it on only when DOTNET_ENVIRONMENT is Development, which is what the AppHost passes along under aspire run and aspire start.
Setting the property in code matters under Aspire. The AppHost also set OTEL_INSTRUMENTATION_GENAI_CAPTURE_MESSAGE_CONTENT=true on the app, and OpenTelemetryAgent uses that variable as its default for EnableSensitiveData. A UseOpenTelemetry call without the configure callback therefore records the messages whenever an AppHost running in Development (the default for aspire run and aspire start) starts the app. Setting the property in code overrides the variable, in both directions.
Turn the token counts into dollars
The framework reports tokens, never money. Prices differ per model and per provider, and they change. So the price table is a small record of your own:
using Microsoft.Extensions.AI;
public sealed record ModelPrice( decimal InputPerMillion, decimal CacheWritePerMillion, decimal CacheReadPerMillion, decimal OutputPerMillion){ public decimal CostOf(UsageDetails? usage) { if (usage is null) { return 0m; }
long input = usage.InputTokenCount ?? 0; long cacheRead = usage.CachedInputTokenCount ?? 0; long cacheWrite = usage.AdditionalCounts? .GetValueOrDefault("CacheCreationInputTokens") ?? 0; long output = usage.OutputTokenCount ?? 0;
decimal dollars = (input - cacheRead - cacheWrite) * InputPerMillion + cacheRead * CacheReadPerMillion + cacheWrite * CacheWritePerMillion + output * OutputPerMillion; return dollars / 1_000_000m; }}The subtractions follow how the Anthropic connector fills UsageDetails. InputTokenCount is every input token of the request: the uncached ones plus the cache reads plus the cache writes. CachedInputTokenCount holds the cache reads, and the cache writes, when there are any, sit in AdditionalCounts under CacheCreationInputTokens. Those three kinds of input token have three different prices, so a cost that multiplies InputTokenCount by the input price overstates the bill once prompt caching is on, and understates it on a request that writes to the cache. The key name in AdditionalCounts is the Anthropic connector’s; another provider reports cache writes under its own key or not at all.
ReasoningTokenCount stays empty. Claude Haiku 5.5’s reasoning tokens are counted in OutputTokenCount and billed as output.
On 14 October 2026, Anthropic’s pricing page listed these prices for Claude Haiku 5.5, per million tokens:
| Kind of token | Prompts up to 100,000 tokens | Prompts over 100,000 tokens |
|---|---|---|
| Input | $0.10 | $0.50 |
| Cache writes (5 minutes) | $0.125 | $0.625 |
| Cache hits | $0.01 | $0.05 |
| Output | $0.50 | $2.50 |
Tip
Two open price lists save copying these numbers by hand. LiteLLM keeps model_prices_and_context_window.json in its repository, in dollars per token, with keys such as input_cost_per_token and separate keys for prompts over 100,000 tokens. models.dev serves https://models.dev/api.json, grouped by provider, in dollars per million tokens, with the higher prices under tiers. On 15 October 2026 both listed the prices in the table above for claude-haiku-5-5 at Anthropic.
Take the entry for the provider you call: the same model on most of Amazon Bedrock’s regional endpoints is listed 10% higher. Neither list is published by the model providers, so check a price against the provider’s own page before a bill depends on it.
The program uses the first column, prints one line per agent run with its cost, and checks the finish reason on each, as in the first post:
// Claude Haiku 5.5, prompts up to 100,000 tokens, in dollars per million// tokens: platform.claude.com/docs/en/about-claude/pricing, 14 October 2026.ModelPrice haiku = new( InputPerMillion: 0.10m, CacheWritePerMillion: 0.125m, CacheReadPerMillion: 0.01m, OutputPerMillion: 0.50m);
decimal total = 0m;
void Report(string name, AgentResponse response){ decimal cost = haiku.CostOf(response.Usage); total += cost; Console.WriteLine( $"[{name}: {response.Usage?.InputTokenCount} in, " + $"{response.Usage?.OutputTokenCount} out, " + $"finish: {response.FinishReason}, {Dollars(cost)}]");
if (response.FinishReason == ChatFinishReason.Length) { Console.Error.WriteLine($"{name} stopped at the output token limit."); }}
Report("kitchen-assistant", answer);The kitchen assistant’s line is in the output under What the run cost.
Trace the workflow too
Workflow telemetry is off by default and is turned on per workflow, with WithOpenTelemetry on the builder. The planner and the reviewer are the agents from the first workflow post, wrapped with the same Traced:
AIAgent planner = Traced(chatClient.AsAIAgent( name: "planner", instructions: """ You plan dinners for one household. Plan three dinners for the request. One line per dinner: the day, the dish and its main ingredients. Nothing else. """));
AIAgent reviewer = Traced(chatClient.AsAIAgent( name: "reviewer", instructions: """ You check a dinner plan against the household's rules: nobody eats peanuts, fish at most once a week, and every weekday dinner takes under 40 minutes. Return the plan in the same format with every broken rule fixed, then one line per change saying which rule it fixed. """));
Workflow workflow = new WorkflowBuilder(planner) .AddEdge(planner, reviewer) .WithOpenTelemetry(otel => otel.EnableSensitiveData = isDevelopment) .Build();The workflow writes its spans to Microsoft.Agents.AI.Workflows, the second name the tracer provider subscribed to. WithOpenTelemetry also takes an ActivitySource of your own, if you’d rather have one name for everything. Its EnableSensitiveData is a separate switch: it defaults to false and ignores the environment variable, so it gets the same isDevelopment.
The run starts as in the first workflow post. This time the loop keeps each agent’s streamed updates, because they carry the token counts that Report needs:
await using StreamingRun run = await InProcessExecution.RunStreamingAsync( workflow, "Dinners for Monday, Wednesday and Saturday. We have salmon.");await run.TrySendMessageAsync(new TurnToken(emitEvents: true));
Dictionary<string, List<AgentResponseUpdate>> updates = [];await foreach (WorkflowEvent evt in run.WatchStreamAsync()){ switch (evt) { case AgentResponseUpdateEvent update: updates.TryAdd(update.ExecutorId, []); updates[update.ExecutorId].Add(update.Update); break; case ExecutorFailedEvent failed: Console.Error.WriteLine($"{failed.ExecutorId} failed: {failed.Data}"); break; case WorkflowErrorEvent error: Console.Error.WriteLine($"Workflow error: {error.Exception}"); break; }}The workflow’s agents report through the updates the loop kept. ToAgentResponse() combines one agent’s updates into an AgentResponse, usage included. The executor ID is the agent’s name, an underscore and its Id, with every run of characters other than letters and digits also turned into an underscore. For one-word names like planner and reviewer, the part before the first underscore is the name:
foreach ((string executorId, List<AgentResponseUpdate> agentUpdates) in updates){ Report(executorId.Split('_')[0], agentUpdates.ToAgentResponse());}
Console.WriteLine($"Total: {Dollars(total)}");Dollars, also at the end of the file, formats the amounts the same way on every machine:
static string Dollars(decimal amount) => amount.ToString("$0.000000", CultureInfo.InvariantCulture);aspire otel traces kitchen-traces now lists three traces, here reduced to the columns that matter:
| Trace | Spans | Duration | Status |
|---|---|---|---|
invoke_agent kitchen-assistant |
4 | 3.38s | OK |
workflow.build |
1 | 17.81ms | OK |
invoke_agent planner |
23 | 6.59s | OK |
workflow.build is a trace of its own: Build() runs outside any other span, so its span has no parent. The third trace is the workflow run. The list names it after the planner’s agent span, but its root is a workflow.session span. Its first spans, from aspire otel spans:
20:20:53.330 OK 6.59s kitchen-traces: workflow.session 95fc00520:20:53.340 OK 6.58s kitchen-traces: workflow_invoke d969b7d20:20:53.341 OK 0.76ms kitchen-traces: edge_group.process 11bac8520:20:53.342 OK 7μs kitchen-traces: edge_group.process 6d76a5a20:20:53.346 OK 4ms kitchen-traces: executor.process planner_a14b15f8cdf14775b90152f9f26f1bcb e8703e020:20:53.350 OK 1.31s kitchen-traces: executor.process planner_a14b15f8cdf14775b90152f9f26f1bcb d1e2b1420:20:53.353 OK 16.22ms kitchen-traces: message.send 367f6c520:20:53.369 OK 0.26ms kitchen-traces: edge_group.process ca3724a20:20:53.373 OK 1.29s kitchen-traces: invoke_agent planner(a14b15f8cdf14775b90152f9f26f1bcb) 69031ce20:20:53.378 OK 1.28s kitchen-traces: chat claude-haiku-5-5 bb798ba[...]20:20:54.664 OK 5.26s kitchen-traces: executor.process reviewer_166c390ac93d470ca95e806c67610e55 67e55d720:20:54.664 OK 0.04ms kitchen-traces: message.send d8173c220:20:54.664 OK 5.26s kitchen-traces: invoke_agent reviewer(166c390ac93d470ca95e806c67610e55) 7b92e3820:20:54.664 OK 5.26s kitchen-traces: chat claude-haiku-5-5 176c800[...]The planner has two executor.process spans: one for the request it collected (4 milliseconds) and one for the turn token that made it answer (1.31 seconds). Its invoke_agent span sits under the second, and its chat span under that. The message.send and edge_group.process spans are the messages being delivered: the input and the turn token to the planner, then the planner’s messages along the edge to the reviewer. In this run the reviewer’s model call took 5.26 of the 6.59 seconds.
WorkflowTelemetryOptions can switch off each kind of span: DisableWorkflowBuild, DisableWorkflowRun, DisableExecutorProcess, DisableEdgeGroupProcess and DisableMessageSend. With sensitive data on, the executor spans record their input as JSON in executor.input, and the message spans the message in message.content. The planner’s first executor.process span held "Dinners for Monday, Wednesday and Saturday. We have salmon.".
What the run cost
aspire logs kitchen-traces shows the output:
You could make a spinach and feta frittata: sauté the onions, add the spinach, then pour in beaten eggs and crumble feta on top before cooking until set. For a heartier meal, serve it with rice on the side. Or make egg fried rice with the onions, spinach, and a little feta stirred in at the end.[kitchen-assistant: 871 in, 206 out, finish: stop, $0.000190][planner: 85 in, 143 out, finish: stop, $0.000080][reviewer: 266 in, 1056 out, finish: stop, $0.000555]Total: $0.000825The counts match the spans: 871 in and 206 out for the kitchen assistant. The whole program cost less than a tenth of a cent, or about 82 cents for a thousand runs.
Output is where the money goes. It costs five times as much per token as input, and the three runs produced 1,405 output tokens against 1,222 input tokens, so output was 85% of the total. The reviewer alone produced 1,056 output tokens, three times as many as the other two runs together, because its reasoning counts as output. It accounts for two thirds of the cost.
The cost per run is only as exact as the price table. Claude Haiku 5.5 charges the higher prices for a request whose prompt is over 100,000 tokens, counted per request. An agent’s Usage adds up all the model calls of a run, so it can’t tell one request of 120,000 tokens from two of 60,000. The per-call counts on the chat spans can. The Batch API discount and the surcharge for US-only inference change the numbers too, and neither shows up in UsageDetails.
Token counts as a metric
A trace answers what one run cost. A chart over days needs a metric, which is what the meter provider at the top is for. The chat telemetry inside each traced agent records a gen_ai.client.token.usage histogram on a meter with the same name as the source, so AddMeter(SourceName) is enough to export it. Each model call adds its input and output counts, tagged with gen_ai.token.type set to input or output. On the dashboard’s Metrics page, the Kitchen meter shows it next to gen_ai.client.operation.duration, gen_ai.client.operation.time_to_first_chunk and gen_ai.client.operation.time_per_output_chunk. Without the meter provider, the token counts are still on every span and absent from every chart.
Each agent run adds its counts too. OpenTelemetryAgent records the run through a chat client of its own, so the run’s total lands in the same histogram as the model calls it is made of, with the same tags. In the console run, the four model calls used 1,218 input tokens (871 for the kitchen assistant’s two calls, 85 for the planner, 262 for the reviewer). The input histogram counted seven entries, four calls and three agent runs, and its final sum was 2,436: twice 1,218. No tag tells the two kinds of entry apart, and gen_ai.client.operation.duration is counted the same way. A chart of this metric shows twice the tokens that were billed; for a total, add up the chat spans or the Usage of each run, as Report does above.
Try it
- Remove the
configureargument fromUseOpenTelemetry, setisDevelopmenttofalseand run through Aspire again. The agent spans still contain the messages, because of the variable Aspire sets. The workflow spans don’t. - Change the price record to another model’s prices from the pricing page and run again. The token counts stay the same; only the dollars change.